Sync SQL data in large scale using Azure SQL Data Sync

“Azure SQL Data Sync allows users to synchronize data between Azure SQL Databases and SQL Server databases in one-direction or bi-direction. This feature was first introduced in 2012. By that time, people didn’t host a lot of large databases in Azure. Some size limitations were applied when we built the data sync service, including up to 30 databases (five on-premises SQL Server databases) in a single sync group, and up to 500 tables in any database in a sync group.

Today, there are more than two million Azure SQL Databases and the maximum database size is 4TB. But those limitations of data sync are still there. It is mainly because that syncing data is a size of data operation. Without an architectural change, we can’t ensure the service can sustain the heavy load when syncing in a large scale. We are working on some improvements in this area. Some of these limitations will be raised or removed in the future. In this article, we are going to show you how to use data sync to sync data between large number of databases and tables, including some best practices and how to temporarily work around database and table limitations”

Read more at https://azure.microsoft.com/en-gb/blog/sync-sql-data-in-large-scale-using-azure-sql-data-sync/


Master-Sync-Group

Recently released: Azure Data Architecture Guide (ADAG) – 36 Articles for Data Professionals

The Azure Data Architecture Guide:

The guide is structured around a basic pivot: The distinction between relational data and non-relational data.

Relational data is generally stored in a traditional RDBMS or a data warehouse. It has a pre-defined schema (“schema on write”) with a set of constraints to maintain referential integrity. Most relational databases use Structured Query Language (SQL) for querying. Solutions that use relational databases include online transaction processing (OLTP) and online analytical processing (OLAP).

Non-relational data is any data that does not use the relational model found in traditional RDBMS systems. This may include key-value data, JSON data, graph data, time series data, and other data types. The term NoSQL refers to databases that are designed to hold various types of non-relational data. However, the term is not entirely accurate, because many non-relational data stores support SQL compatible queries. Non-relational data and NoSQL databases often come up in discussions of big data solutions. A big data architecture is designed to handle the ingestion, processing, and analysis of data that is too large or complex for traditional database systems.

Within each of these two main categories, the Data Architecture Guide contains the following sections:

  • Concepts. Overview articles that introduce the main concepts you need to understand when working with this type of data.
  • Scenarios. A representative set of data scenarios, including a discussion of the relevant Azure services and the appropriate architecture for the scenario.
  • Technology choices. Detailed comparisons of various data technologies available on Azure, including open source options. Within each category, we describe the key selection criteria and a capability matrix, to help you choose the right technology for your scenario.

This guide is not intended to teach you data science or database theory — you can find entire books on those subjects. Instead, the goal is to help you select the right data architecture or data pipeline for your scenario, and then select the Azure services and technologies that best fit your requirements. If you already have an architecture in mind, you can skip directly to the technology choices.

Traditional RDBMS

Concepts

Scenarios

Big data and NoSQL

Concepts

Scenarios

Cross-cutting concerns

Creating custom Power BI visuals? (… and adding interactivity to Power BI dashboard)

Power BI VisualIf you are wondering how to create custom visuals for Power BI? Then, handily, there is an increasing number of open source samples and visuals becoming available.

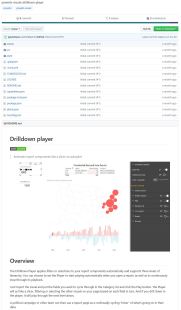
Once such visualisation is the Drilldown Player, release by Microsoft as Open Source, and built in conjunction with their partner Gramener (http://gramener.com).

You can get the code from GitHub @ https://github.com/Microsoft/powerbi-visuals-drilldown-player.

You can get the compiled visual @ https://store.office.com/en-us/app.aspx?assetid=WA104381035&sourcecorrid=bde0be33-be77-400c-a17c-19849a52e1f5&ui=en-US&rs=en-US&ad=US&appredirect=false

Chris Webb recently shared a blog post about using this visual to add interactivity… Creating Animated Reports In Power BI With The Drilldown Player Custom Visual

Chris Webb's BI Blog

Last week I had the chance to do something I have not done before: build a Power BI report to be displayed on a big screen hanging on a wall. To make up for the loss of user interactivity, I used the new Drilldown Player custom visual to cycle through different selections and display a new slice of data every few seconds; Devin Knight’s blog post here has a great summary of how to use it. However I wasn’t happy about the look of the Drilldown Player visual in this particular report: the play/stop/pause buttons aren’t much use if you can’t click on them and the visual doesn’t show all of the values that it is cycling through. As a result I hid the visual behind another one and came up with a different way of displaying the currently-displayed selection.

Here’s a simple example of what I did. Imagine you…

View original post 271 more words