.NET Conf, a free virtual event for developers

Are you ready to learn all about .NET? .NET Conf 19th to 21st September 2017 is a free virtual conference. #dotnetconf – http://www.dotnetconf.net/


More Details…

The .NET Conf is a free, 3 day virtual developer event co-organized by the .NET community and Microsoft. Some of the speakers lined up so far: –

Scott Hunter

Scott Hunter – Director of Program Management, .NET

Kasey Uhlenhuth

Kasey Uhlenhuth – Program Manager, .NET

Mads Torgersen

Mads Torgersen – C# Language Designer

Mikayla Hutchinson

Mikayla Hutchinson – Principal Program Manager, Xamarin

Scott Hanselman

Scott Hanselman – Principal Program Manager, .NET

What’s in store for you?

“Over the course of the three days you have a wide selection of live sessions that feature speakers from the community and .NET product teams. These are the experts in their field and it is a chance to learn, ask questions live, and get inspired for your next software project.

You will learn to build for web, mobile, desktop, games, services, libraries and more for a variety of platforms and devices all with .NET. We have sessions for everyone, no matter if you are just beginning or are a seasoned engineer. We’ll have presentations on .NET Core and ASP.NET Core, C#, F#, Roslyn, Visual Studio, Xamarin, and much more.”

Check out http://www.dotnetconf.net/ for more details…

Latest SSRS Report Viewer Now Generally Available

Microsoft has just released its latest update to the Report Viewer for SQL Server generally available.

This update replaces the Report Viewer 2015 version and has included several enhancements made for SSRS 2016; including modern browser support, cross-browser printing, report parameter positioning, and a modern look-and-feel.

As with previous releases of the SSRS Report Viewer Control, it is also backwards compatible and works with SSRS versions 2008-2017.

For more details please visit: http://tinyurl.com/ReportViewer2017

To install Microsoft.ReportingServices.ReportViewerControl.WebForms, run the following command in the Package Manager Console

Install-Package Microsoft.ReportingServices.ReportViewerControl.WebForms

See Reporting Services Blog for additional information https://blogs.msdn.microsoft.com/sqlrsteamblog


About the Report Viewer control

We’ve heard from many of you using the existing Report Viewer 2015 control in your existing ASP.NET Web Forms apps and awaiting an updated version with, among other things, modern browser support. This update is for you.

A few things to know about this Report Viewer control:

  • It’s an ASP.NET Web Forms control (there’s a Windows Forms version as well) for your existing apps. (Developing new web apps on ASP.NET Core/MVC and other web frameworks? Know that your scenario is on our radar as well.)
  • It enables you to embed paginated (RDL) reports into your app. (Looking to embed Power BI reports or mobile reports? We’re not building that support into the existing Report Viewer control since it’s limited to ASP.NET Web Forms apps, but you can embed any report using an iframe and the rs:Embed=true URL parameter.)
  • It supersedes the Report Viewer 2015 version and includes several enhancements we made for SSRS 2016: modern browser support, cross-browser printing, report parameter positioning, and a modern look-and-feel.
  • It works with SSRS 2008-2017, and with paginated reports stored in Power BI Report Server.

What’s new in this update

With this update, the Report Viewer control

  • Includes Microsoft.SqlServer.Types and SqlServerSpatial140 assemblies, which you may need to render reports that contain maps.
  • Won’t affect your app’s version of jQuery.
  • Won’t affect your app’s jQuery UI CSS.
  • Supports the SizeToReportContent setting in IE11 and Firefox.
  • Reduces occurrences of redundant scrollbars in IE11.
  • Shows correct toolbar buttons on pages whose ResponseEncoding is not UTF-8.

Install the NuGet package

To install the Report Viewer control into your app,

  1. Open your ASP.NET Web Forms project in Visual Studio 2015 or 2017.
  2. Open the NuGet Package Manager Console (Tools > NuGet Package Manager > Package Manager Console).
  3. Enter this command in the console:
    Install-Package Microsoft.ReportingServices.ReportViewerControl.WebForms

That’s it; your project now has the files you need.

Add a Report Viewer control to your page

If your project doesn’t reference an earlier version of the Report Viewer control, you’re ready to add a Report Viewer control to your page. You’ll need to add

  • A Register tag.
  • A ScriptManager control.
  • The ReportViewer control itself.

Your page will look something like the following:

<%@ Page Language=”C#” AutoEventWireup=”true” CodeFile=”Default.aspx.cs” Inherits=”_Default” %>
<%@ Register Assembly=”Microsoft.ReportViewer.WebForms, Version=14.0.0.0, Culture=neutral, PublicKeyToken=89845dcd8080cc91″ Namespace=”Microsoft.Reporting.WebForms” TagPrefix=”rsweb” %>

<!DOCTYPE html>
<html xmlns=”http://www.w3.org/1999/xhtml”>

<head runat=”server”>
< title></title>
< /head>

<body>
< form id=”form1″ runat=”server”>

  <asp:ScriptManager runat=”server”></asp:ScriptManager>

  <rsweb:ReportViewer ID=”ReportViewer1″ runat=”server” ProcessingMode=”Remote” Width=”850px” Height=”680px”>
<ServerReport ReportServerUrl=”http://your-report-server/reportserver” ReportPath=”/Some Folder/Some Report” />
</rsweb:ReportViewer>

</form>
< /body>

</html>

Just use your ReportServerUrl and ReportPath in place of the sample values above.

Check out this article for a step-by-step walkthrough.

Update an existing app

If your existing project references a previous version of the Report Viewer control, you’ll need to update a few references in your web pages and web.config file; see this article for more info.

Source: https://blogs.msdn.microsoft.com/sqlrsteamblog/2017/07/27/updated-report-viewer-control-now-generally-available/

Creating custom Power BI visuals? (… and adding interactivity to Power BI dashboard)

Power BI VisualIf you are wondering how to create custom visuals for Power BI? Then, handily, there is an increasing number of open source samples and visuals becoming available.

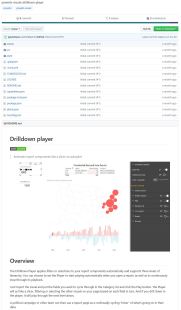
Once such visualisation is the Drilldown Player, release by Microsoft as Open Source, and built in conjunction with their partner Gramener (http://gramener.com).

You can get the code from GitHub @ https://github.com/Microsoft/powerbi-visuals-drilldown-player.

You can get the compiled visual @ https://store.office.com/en-us/app.aspx?assetid=WA104381035&sourcecorrid=bde0be33-be77-400c-a17c-19849a52e1f5&ui=en-US&rs=en-US&ad=US&appredirect=false

Chris Webb recently shared a blog post about using this visual to add interactivity… Creating Animated Reports In Power BI With The Drilldown Player Custom Visual

Chris Webb's BI Blog

Last week I had the chance to do something I have not done before: build a Power BI report to be displayed on a big screen hanging on a wall. To make up for the loss of user interactivity, I used the new Drilldown Player custom visual to cycle through different selections and display a new slice of data every few seconds; Devin Knight’s blog post here has a great summary of how to use it. However I wasn’t happy about the look of the Drilldown Player visual in this particular report: the play/stop/pause buttons aren’t much use if you can’t click on them and the visual doesn’t show all of the values that it is cycling through. As a result I hid the visual behind another one and came up with a different way of displaying the currently-displayed selection.

Here’s a simple example of what I did. Imagine you…

View original post 271 more words

Development Workflows for Data Scientists • Free eBook

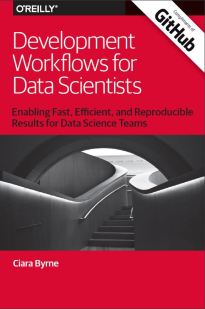
Development Workflows for Data Scientists - Free eBook.JPGEnabling Fast, Efficient, and Reproducible Results for Data Science • via GitHub

GitHub partnered with O’Reilly Media to examine how data science and analytics teams at several data-driven organizations are improving the way they define, enforce, and automate development workflows.

Download this complimentary book from: – https://resources.github.com/whitepapers/data-science/ 

Power BI custom visual from Visio

Visualize business process workflows, real-world layouts like factory floor plans, network diagrams, organization structures or any illustration created in Microsoft Visio and easily connect it to Power BI data. Contextually represent Power BI data as colours or text on Visio diagrams. Now drive Operational Intelligence effectively using Visio custom visual.

MEAN.js with Cosmos DB on Azure

(a YouTube series by John Papa)

Cosmos DB is of significant interest to myself for projects I have been engaged in for the past couple of years which use MongoDB and MEAN in several ways. Scaling for us has always been a bit of a pain with MongoDB, and Cosmos DB on Azure looks to be relieving a lot of the headaches we have had.

MEAN stands for MongoDB, Express, Angular and Node.

I am not the author of these – this is a reference list to a YouTube series by John Papa introducing MEAN with Cosmos DB on Azure. I would normally just link directly to the creators blog or post for a series such as this, but it seems to be offline just now so I thought I would share a full list of current videos here – hopefully the original link will work again soon – which is https://johnpapa.net/angular-cosmosdb-1/.


MEAN.js with Cosmos DB – Part 1: Introduction

John builds a lot of apps with MongoDB, Express, Angular and Node (MEAN). MongoDB just works so well with these, but recently he has been using Cosmos DB on Azure in its place because it’s easy to use, scale, is super fast, and he does not have to change how he codes.


MEAN.js with Cosmos DB – Part 2: Creating the Node.js and Express App

Creating a Node.js and Express App along with the Angular CLI. Then create a web API endpoint and try it out.


MEAN.js with Cosmos DB – Part 3: Angular and Express APIs

The A in MEAN stands for Angular. This video shows how to build an Angular UI that talks to the Express API, with GET, POST, PUT, and DELETE.


MEAN.js with Cosmos DB – Part 4: Creating and Deploying Cosmos DB

Using the Azure CLI, to create the Cosmos DB account to represent a MongoDB model database and deploy it to Azure. Then view what we created in the Azure portal.


MEAN.js with Cosmos DB – Part 5: Querying Cosmos DB

How to connect to the MongoDB database with Azure Cosmos DB, using Mongoose, and query it for data.

You can subscribe to John’s YouTube series at https://www.youtube.com/playlist?list=PLbnXt_I6OfBWU9JiDNewZm11-7eFQf70M or follow him on twitter @John_Papa

Second version of HoloLens HPU will incorporate AI coprocessor for implementing DNNs

HPU_2.0_1260x539-1024x438.png

Posted July 23, 2017 | by Microsoft Research Blog

By Marc Pollefeys, Director of Science, HoloLens

It is not an exaggeration to say that deep learning has taken the world of computer vision, and many other recognition tasks, by storm. Many of the most difficult recognition problems have seen gains over the past few years that are astonishing.

Although we have seen large improvements in the accuracy of recognition as a result of Deep Neural Networks (DNNs), deep learning approaches have two well-known challenges: they require large amounts of labelled data for training, and they require a type of compute that is not amenable to current general purpose processor/memory architectures. Some companies have responded with architectures designed to address the particular type of massively parallel compute required for DNNs, including our own use of FPGAs, for example, but to date these approaches have primarily enhanced existing cloud computing fabrics.

But I work on HoloLens, and in HoloLens, we’re in the business of making untethered mixed reality devices. We put the battery on your head, in addition to the compute, the sensors, and the display. Any compute we want to run locally for low-latency, which you need for things like hand-tracking, has to run off the same battery that powers everything else. So what do you do?

You create custom silicon to do it.

First, a bit of background. HoloLens contains a custom multiprocessor called the Holographic Processing Unit, or HPU. It is responsible for processing the information coming from all of the on-board sensors, including Microsoft’s custom time-of-flight depth sensor, head-tracking cameras, the inertial measurement unit (IMU), and the infrared camera. The HPU is part of what makes HoloLens the world’s first–and still only–fully self-contained holographic computer.

Today, Harry Shum, executive vice president of our Artificial Intelligence and Research Group, announced in a keynote speech at CVPR 2017, that the second version of the HPU, currently under development, will incorporate an AI coprocessor to natively and flexibly implement DNNs. The chip supports a wide variety of layer types, fully programmable by us. Harry showed an early spin of the second version of the HPU running live code implementing hand segmentation.

The AI coprocessor is designed to work in the next version of HoloLens, running continuously, off the HoloLens battery. This is just one example of the new capabilities we are developing for HoloLens, and is the kind of thing you can do when you have the willingness and capacity to invest for the long term, as Microsoft has done throughout its history. And this is the kind of thinking you need if you’re going to develop mixed reality devices that are themselves intelligent. Mixed reality and artificial intelligence represent the future of computing, and we’re excited to be advancing this frontier.

Source: https://www.microsoft.com/en-us/research/blog/second-version-hololens-hpu-will-incorporate-ai-coprocessor-implementing-dnns/

AI for security: Microsoft Security Risk Detection makes debut

Full details at: – https://blogs.microsoft.com/next/2017/07/21/ai-for-security-microsoft-security-risk-detection-makes-debut/

Microsoft is making a cloud service that uses artificial intelligence to track down bugs in software generally available, and it will begin offering a preview version of the tool for Linux users as well.

Microsoft Security Risk Detection, previously known as Project Springfield, is a cloud-based tool that developers can use to look for bugs and other security vulnerabilities in the software they are preparing to release or use. The tool is designed to catch the vulnerabilities before the software goes out the door, saving companies the heartache of having to patch a bug, deal with crashes or respond to an attack after it has been released.

New M Functionality And Behaviour In Power BI Custom Data Connectors

Chris Webb's BI Blog

Over the past few weeks I’ve spent some time playing around with Power BI custom data connectors and while I don’t have anything to share publicly yet (other people are way ahead of me in this respect – see the work of Igor Cotruta, Miguel Escobar and Kasper de Jonge among others) I have learned some interesting things that are worth blogging about.

First of all, the data privacy rules around combining data from different data sources do not apply in custom data connector code. As the docs say here:

Data combination checks do not occur when accessing multiple data sources from within an extension. Since all data source calls made from within the extension inherit the same authorization context, it is assumed they are “safe” to combine. Your extension will always be treated as a single data source when it comes to data combination rules. Users would…

View original post 339 more words