Technical Reference Implementation for Enterprise BI and Reporting…

Technical Reference Implementation for Enterprise BI and Reporting

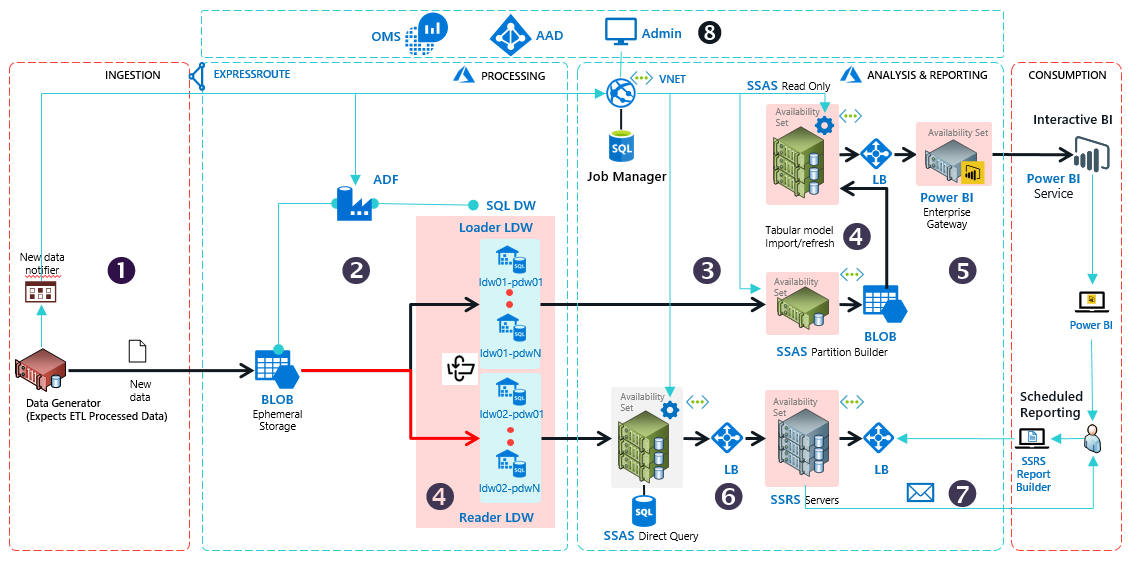
Azure offers a rich data and analytics platform for customers and ISVs seeking to build scalable BI and reporting solutions. However, customers face pragmatic challenges in building the right infrastructure for enterprise-grade production systems. They have to evaluate the various products for security, scale, performance and geo-availability requirements. They have to understand service features and their interoperability, and they must plan to address any perceived gaps using custom software. This takes time, effort, and many times, the end-to-end system architecture they design is sub-optimal.

ref: https://github.com/Azure/azure-arch-enterprise-bi-and-reporting/blob/master/README.md

Our solution included in Microsoft Ignite 2017 Keynote

Azure Cosmos DB, Azure DW, Machine Leaning, Deep Learning, Neural Networks, TensorFlow, SQL Server, ASP.NET Core… are just a few of the components that make up one of the solutions we are currently developing.

Have been under a social media embargo, until today, but now that the Microsoft Ignite 2017 keynote has taken place, I am able to proudly say that the solution our team has been working on for some time was part of the Keynote addresses.

During the second keynote lead by Scott Guthrie, Danielle Dean a Data Scientist Lead discussed at a high level, one of the solutions we are developing at Jabil, which involves advanced image recognition of circuit board issues. The keynote focused in on the context of the solutions data science portion and introduced the new Azure Machine Learning Workbench to the packed audience.

Tomorrow morning there is a session – “Using big data, the cloud, and AI to enable intelligence at scale” (Tuesday, September 26, from 9:00 AM to 10:15 AM, in Hyatt Regency Windermere X)… during which we will be going into a bit more detail, and the guys at Microsoft will be expanding on the new AI and Big Data machine learning capabilities (session details via this link).

Creating custom Power BI visuals? (… and adding interactivity to Power BI dashboard)

Power BI VisualIf you are wondering how to create custom visuals for Power BI? Then, handily, there is an increasing number of open source samples and visuals becoming available.

Once such visualisation is the Drilldown Player, release by Microsoft as Open Source, and built in conjunction with their partner Gramener (http://gramener.com).

You can get the code from GitHub @ https://github.com/Microsoft/powerbi-visuals-drilldown-player.

You can get the compiled visual @ https://store.office.com/en-us/app.aspx?assetid=WA104381035&sourcecorrid=bde0be33-be77-400c-a17c-19849a52e1f5&ui=en-US&rs=en-US&ad=US&appredirect=false

Chris Webb recently shared a blog post about using this visual to add interactivity… Creating Animated Reports In Power BI With The Drilldown Player Custom Visual

Chris Webb's BI Blog

Last week I had the chance to do something I have not done before: build a Power BI report to be displayed on a big screen hanging on a wall. To make up for the loss of user interactivity, I used the new Drilldown Player custom visual to cycle through different selections and display a new slice of data every few seconds; Devin Knight’s blog post here has a great summary of how to use it. However I wasn’t happy about the look of the Drilldown Player visual in this particular report: the play/stop/pause buttons aren’t much use if you can’t click on them and the visual doesn’t show all of the values that it is cycling through. As a result I hid the visual behind another one and came up with a different way of displaying the currently-displayed selection.

Here’s a simple example of what I did. Imagine you…

View original post 271 more words